1) Exploratory Data Analysis - Classification
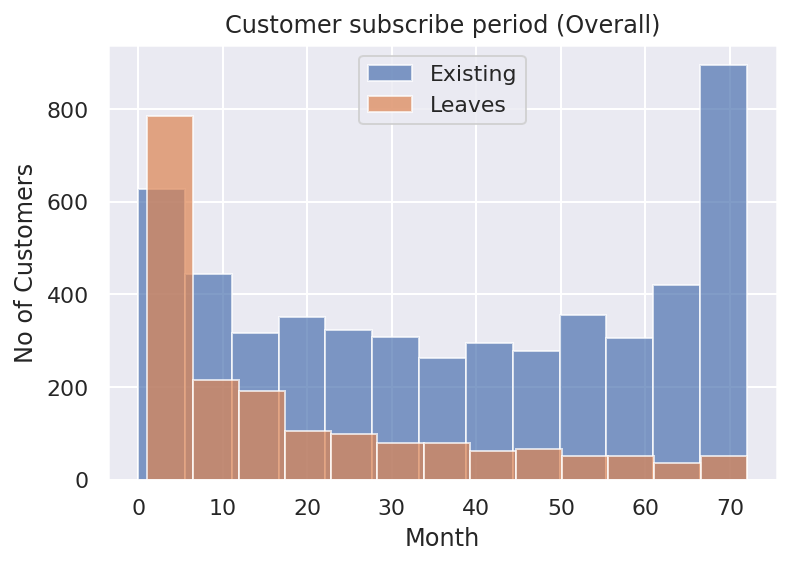
This is a telco customer's churn dataset from kaggle. OSEMN framework is implemented to complete this data science project. In this dataset we are looking the reason of customer left (churn). The churn rate in this dataset is 26.54%, which I consider quite high. It is important to maintain existing customer than getting a new customer. By using logistic regression model, we get an accurancy score of 80.60% .
2) Exploratory Data Analysis - Clustering
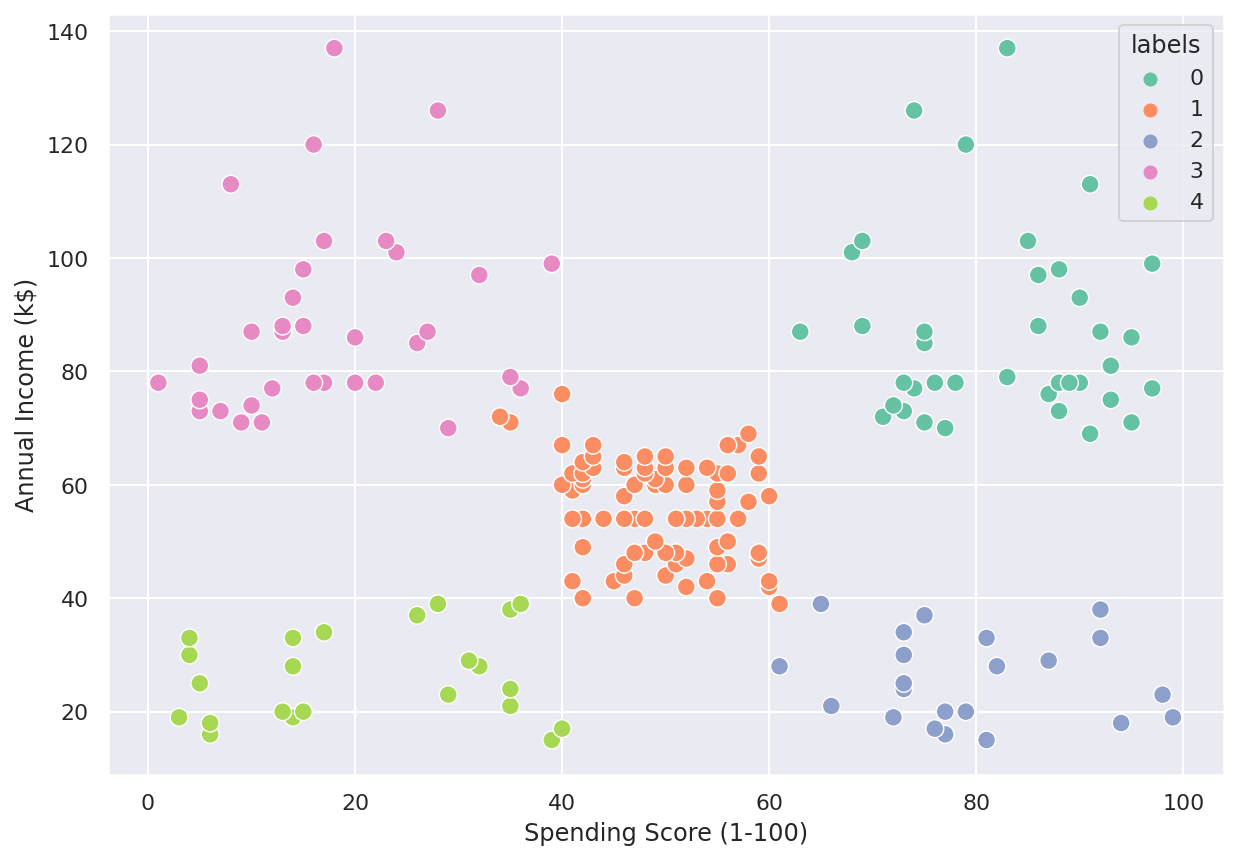
This is a customer's mall dataset from kaggle. OSEMN framework is implemented to explore the data. In this dataset we would like to segment our customer into particular group. By using K-Means clustering to group similar customer, the optimal number of cluster is 5. Since the segmentation of customer, this can provide a better quality services to meet customer expectation. Besides, the resources can plan accordingly in order to boost business profit.
3) Data Visualization
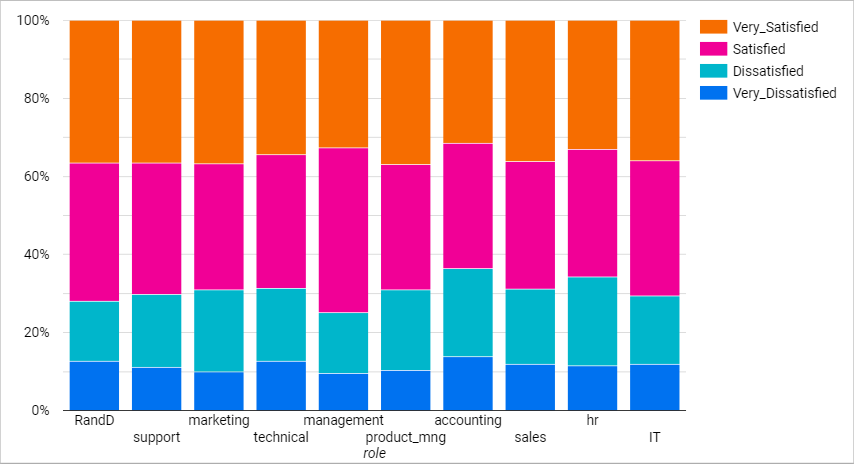
I build a dashboard to show a quick overview and obtain insights from this data. To build this dashboard, I obtain the dataset from kaggle.com. This HR dataset then store into google data studio to create graphs and figures. This dataset consist of 15,000 rows and 10 columns. SQL query(case statement) is applied on this dataset by converting the satisfaction level (continuous data) into category and visualize in Stacked Bar chart.
The interesting topic I could find out are:
- Employee who work with 3-5 projects are less likely to leave the company.
- Average attrition rate is about 23.80%. HR and Accounting department having high dissatisfaction level.
- Majority of employee with 2-3 years of experience in the company.
4) Web Scraping
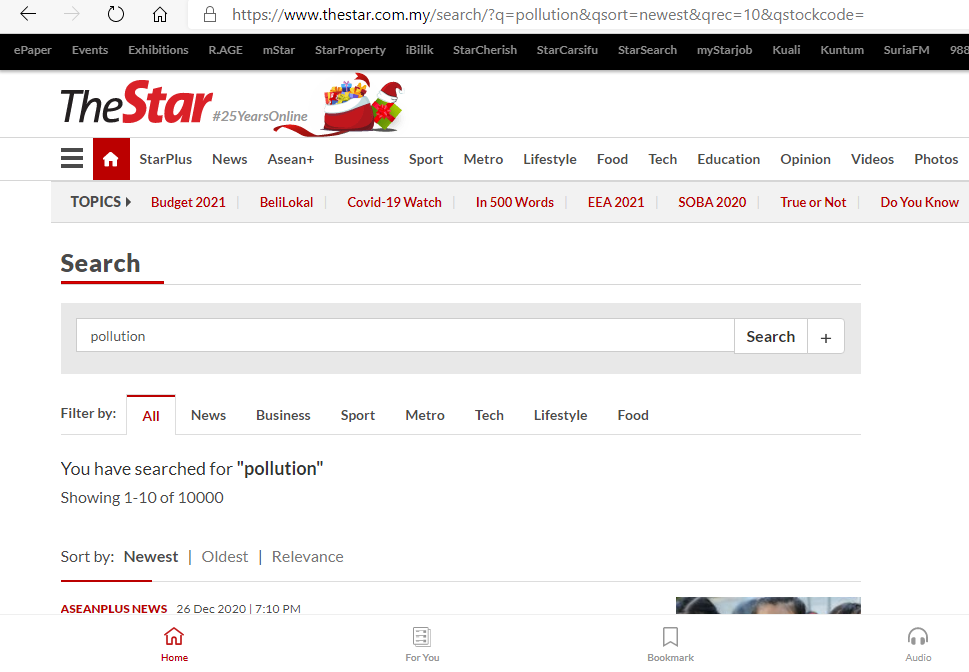
I extracted of structured information from website (The Star News). In order to get the information from multiple articles, I used scraping tool like Python and BeautifulSoup to parsing HTML from web. A keyword should be placed on The Star New's search engine to generate an URL. The final information of title, full text and date of numerous news article will be stored inside NoSQL database (Firebase) for further analysis such as NLP.
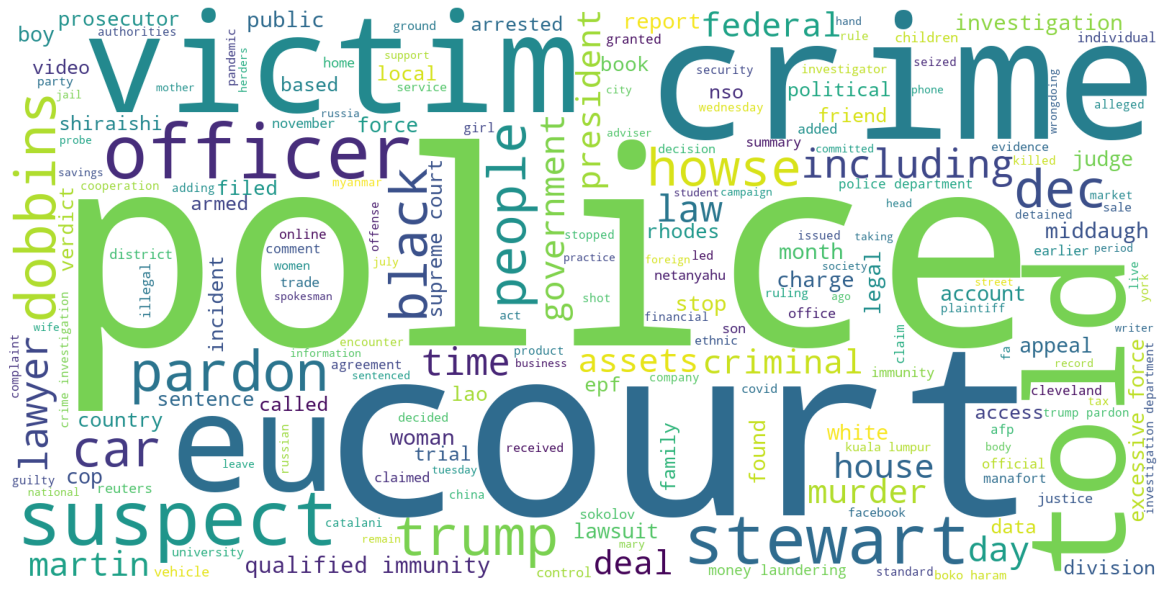
5) Natural Language Processing (NLP)
In NLP the machine is taught to understand human languages. Continue from previous project, load the data stored on Firestore. Whole data then go thought tokenization process and remove meaningless words. The frequent of words are shown from most common to least with respective number of times its appear from all the articles. By visualize using WordCloud, we can easily spot what are the words frequently mention that we scrap from The Star News.